

Social Media Users Worldwide
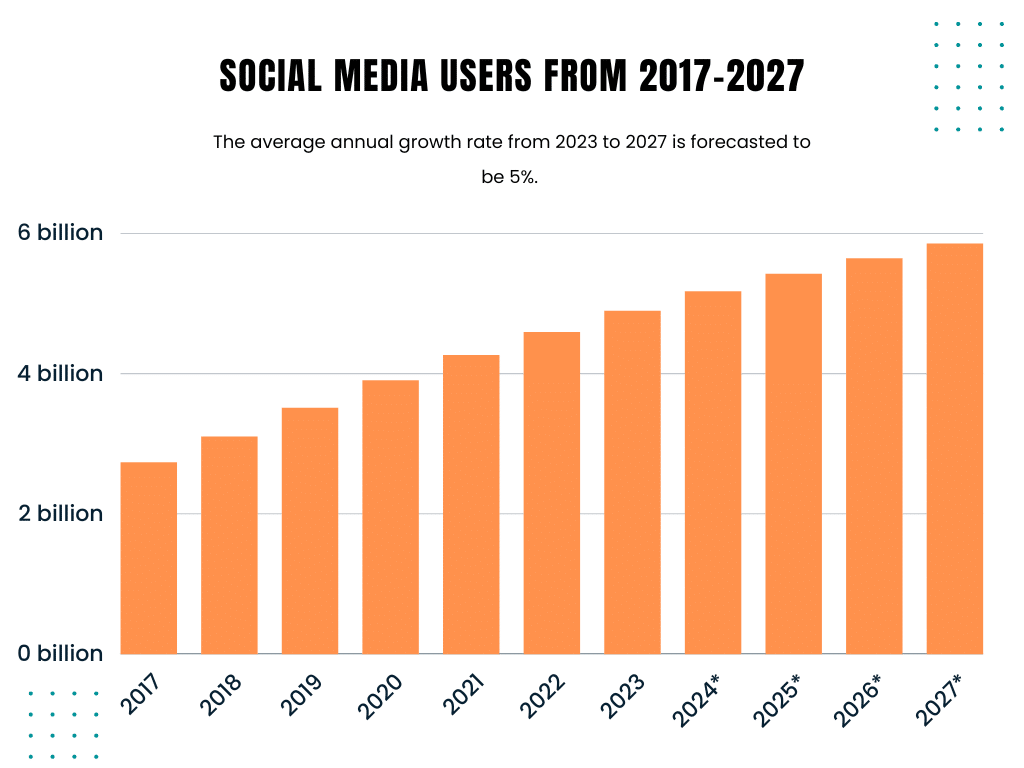
The number of social media users worldwide grew by only 3% YoY from January 2022 to January 2023 (+137 million users.)
Here are some more insights into the number of social media users from 2017 to 2027.
Social Media Users By Region
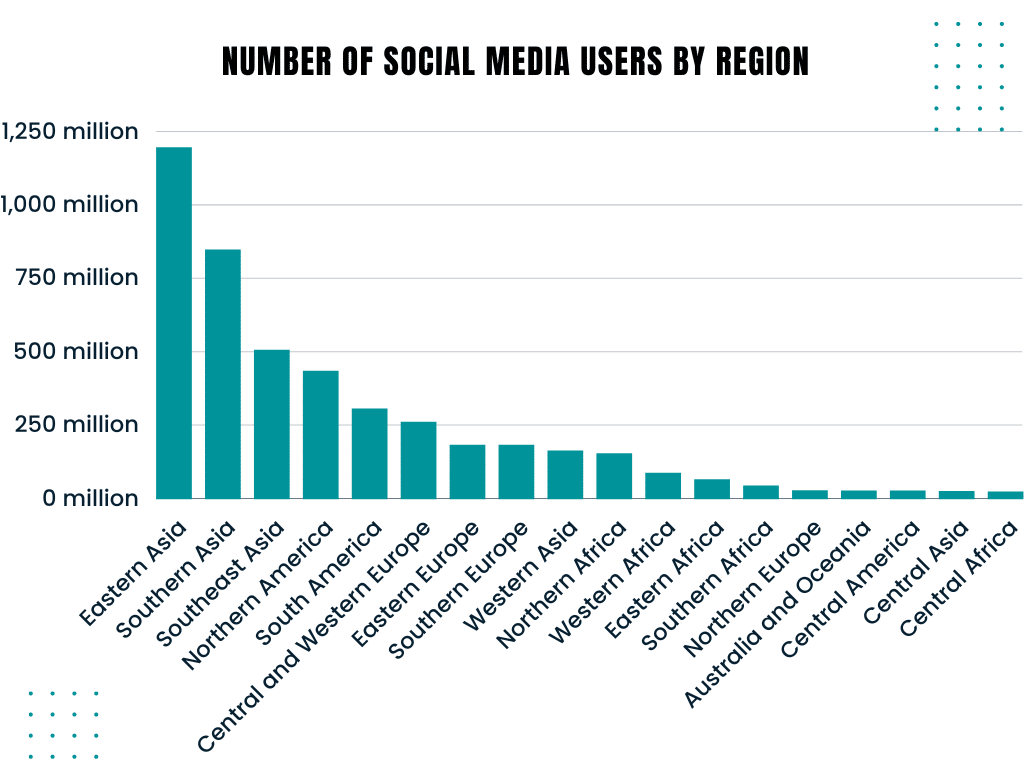
East Asia has the most social media users worldwide, with 1,194.2 million.
East Asia has the most significant social media users, with 1.2 billion users making up 14.9% of the world’s population. This includes China, the world’s most populous country.
Here is a table showing the number of social media users by region.
Social Media Users By Countries
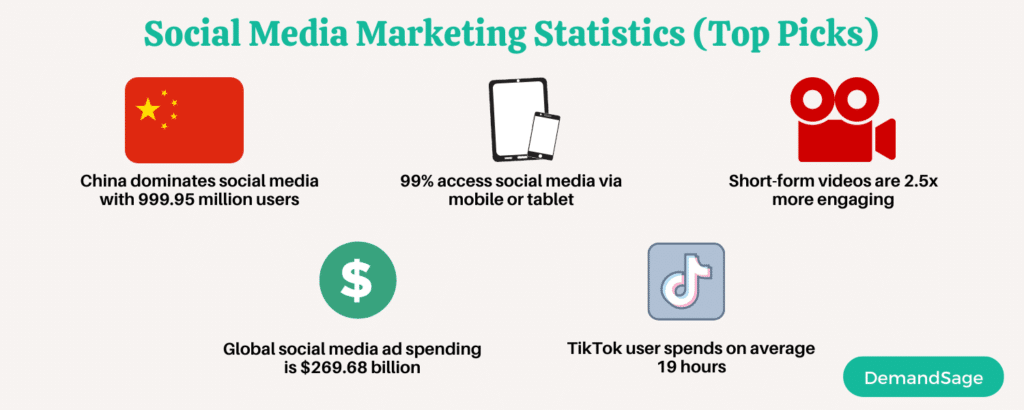
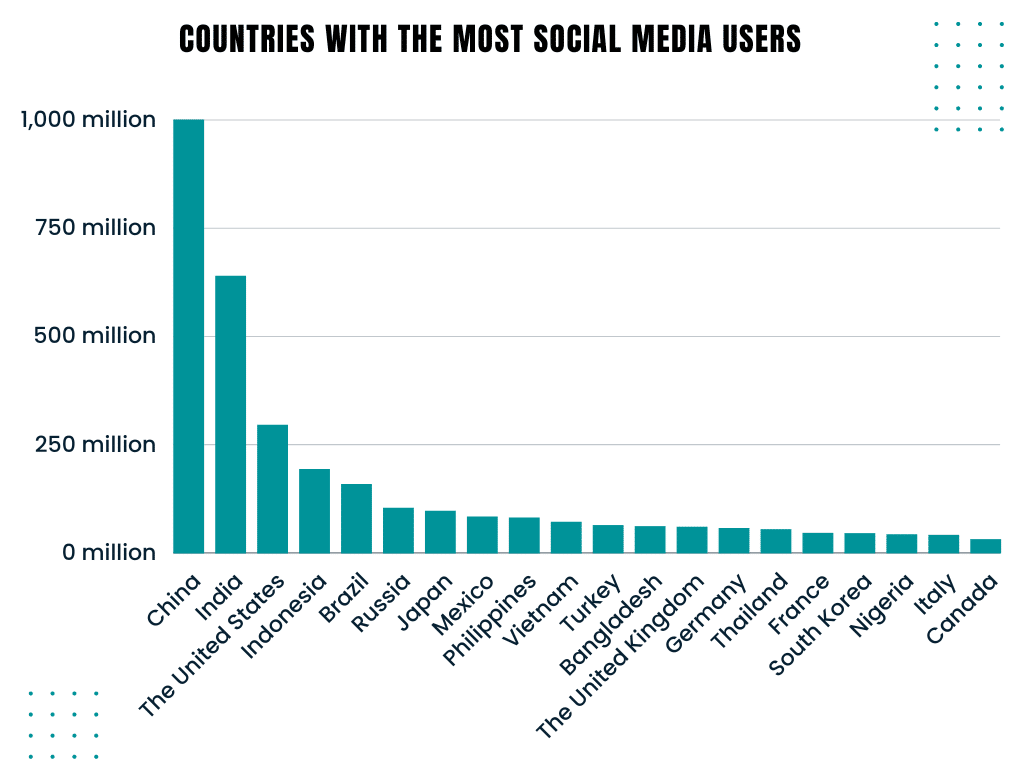
China has the most social media users worldwide, with 999.95 million users as of 2023.
The United States is third, with 295.48 million users, which is 6.04% of all social media users.
A table shows the top countries with the most social media users worldwide as of 2023.
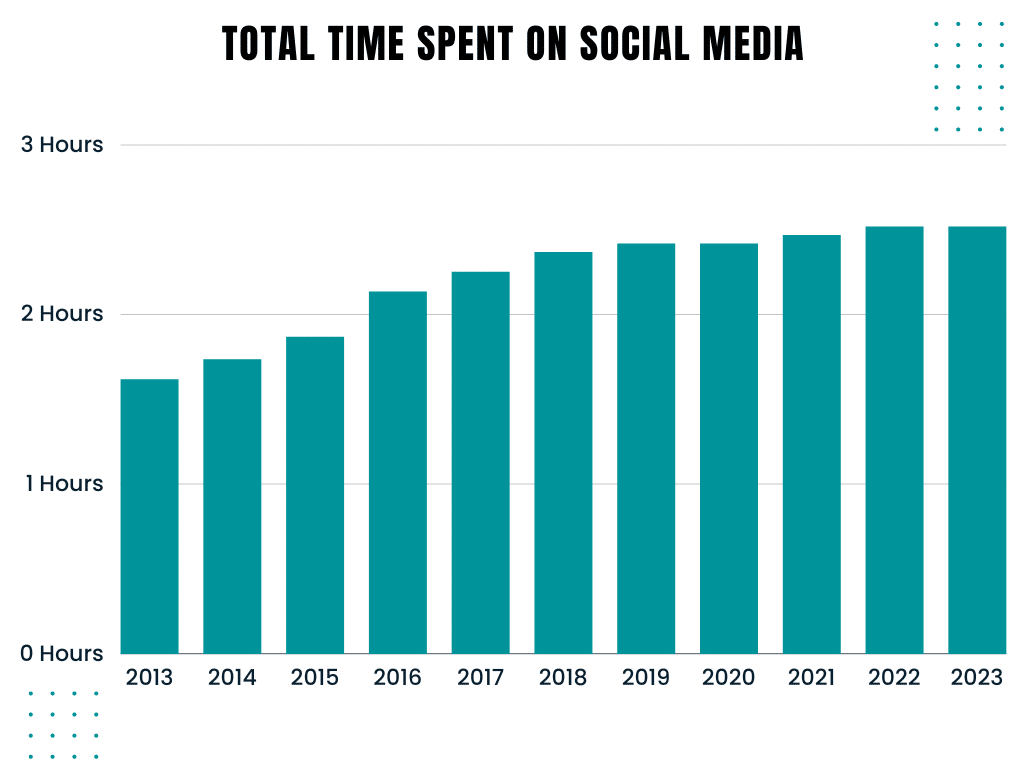
Social Media Average Time Spent
As of 2023, the average time spent on social media is 2 hours and 31 minutes.
The amount of time people spend on social media is steadily increasing each year. Between 2013 and 2023, it increased by 1 hour and 34 minutes.
According to Data Reportal, the average time spent on social media in 2023 was 2 hours and 31 minutes, which remained the same as the previous year.
Below is a table that displays the average time spent on social media from 2013 to 2023.
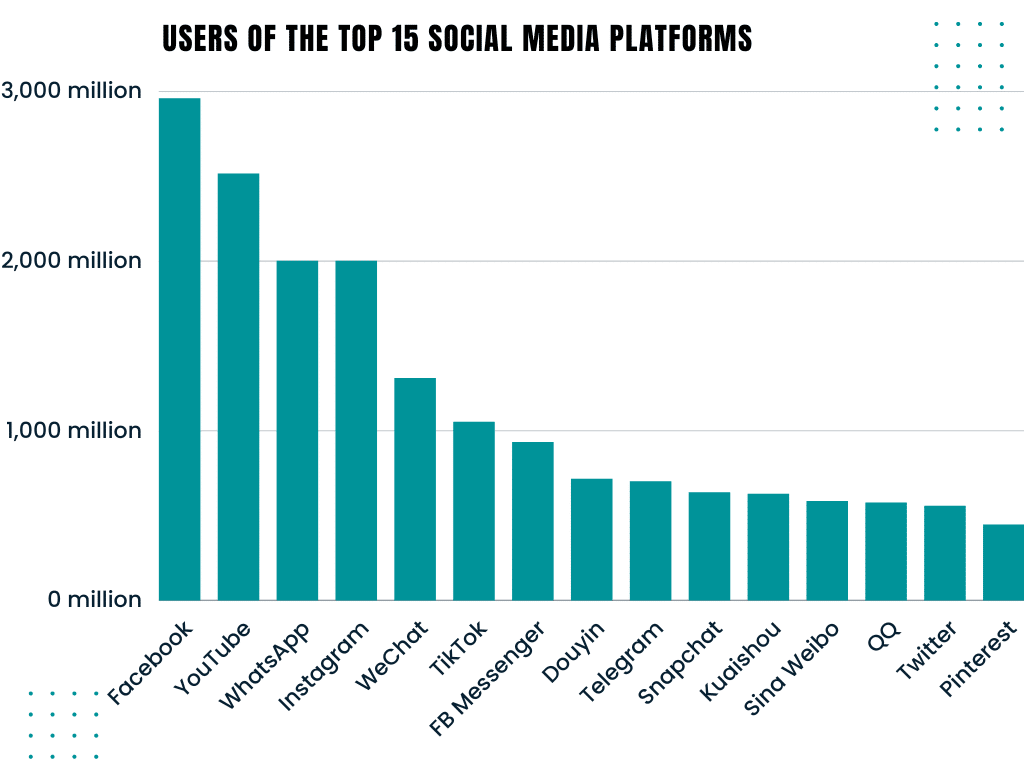
Top Social Media Platforms Users
Facebook is the world’s most-used social media, with 2,958 million users. YouTube comes in second place, with 2.514 billion users, followed by WhatsApp and Instagram, which have 2 billion users each.
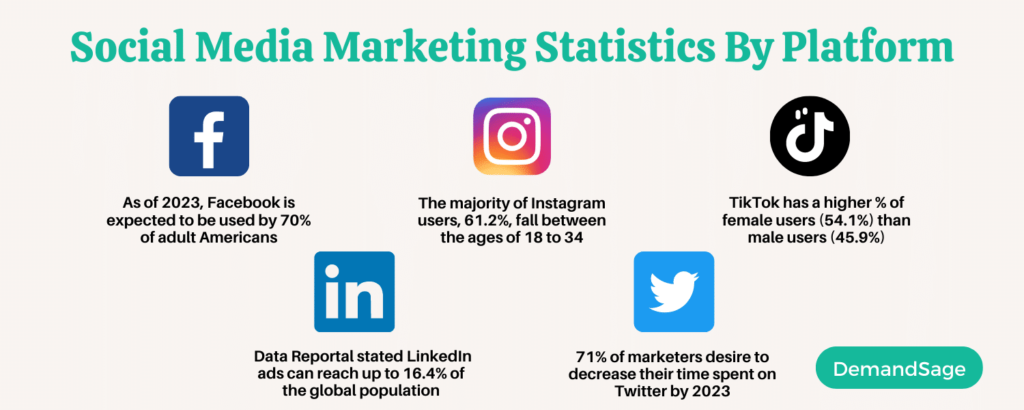
- 70% of American adults use Facebook
- An average American spends 33 minutes per day on Facebook.
- 6% of Facebook users are male and 43.4% are female (based on available gender data.)
- Almost a quarter of Facebook users in the US are between the ages 25-34.
This table shows the users of the top 15 social media platforms.
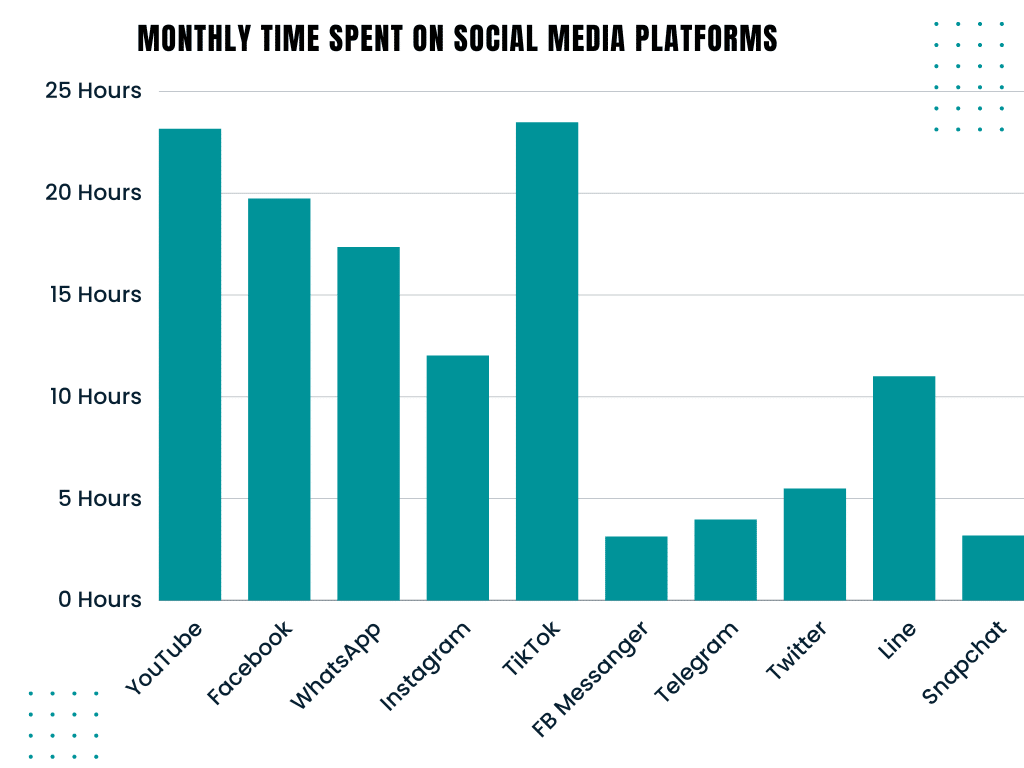
Monthly Time Spent On Social Media
Social Media users spend the most time on TikTok, with 23 hours and 28 minutes per month. TikTok is the social media platform where users spend the most time monthly.
The following table shows the monthly time spent on various social media platforms.
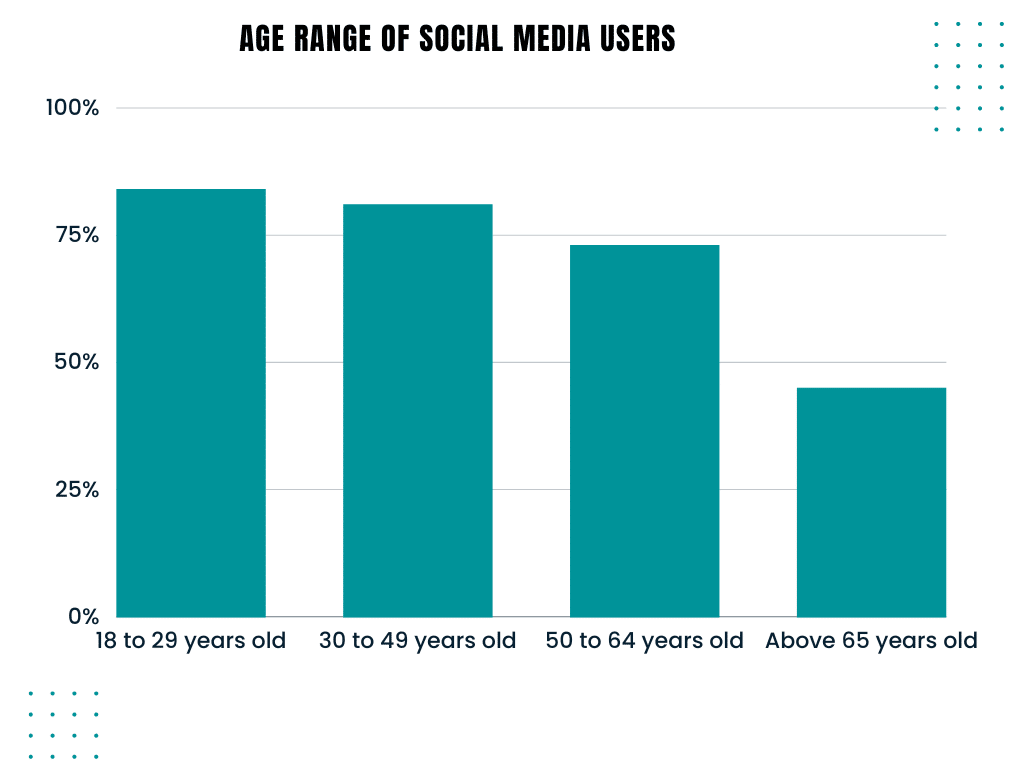
Age Range Of Social Media Users
Around 84% of people aged 18-29 use at least one social media platform.
According to Forbes, social media usage has been more common among the younger generation, with 84% of those aged between 18 and 29 and 81% of people aged between 30 and 49 actively using at least one social media platform.
A table shows the complete insights into the above study.
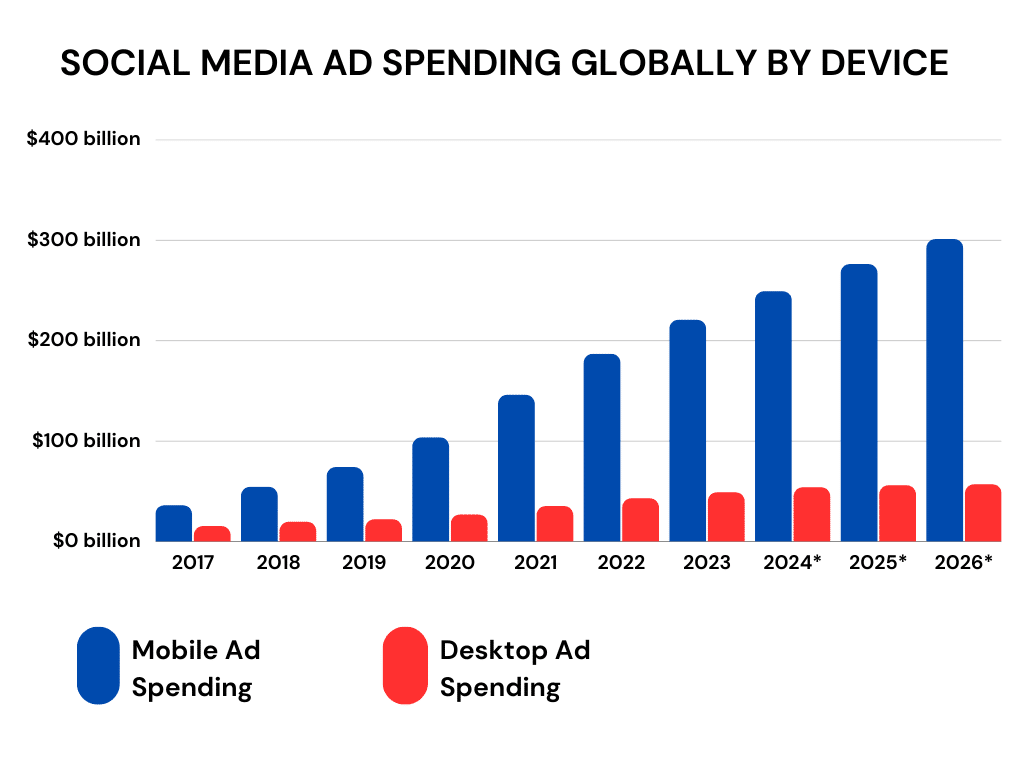
Social Media Ad Spending Globally
In 2023, it is projected that $220.5 billion of the total ad spending on social media will be generated through mobile ads worldwide.
Every year from 2017 to 2023, most social media ad spending was spent on mobile advertising, which will be the same in the future.
According to Statista, by the end of 2026, $300.8 billion will be spent on mobile social media advertising and only $57.12 billion on desktop advertising.
A table shows total social media ad spending globally from 2017 to 2026 by device (*Projected).
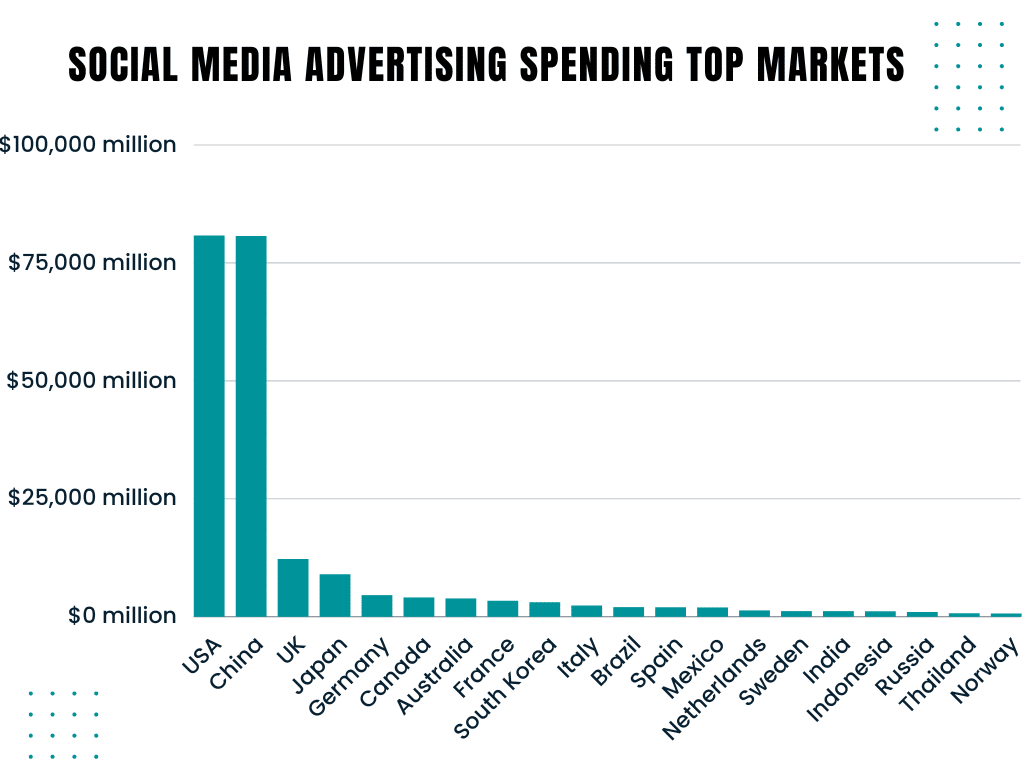
Social Media Ad Spending Top Markets
In the United States, social media ad spending was $80,670 million in 2022.
According to Statista, China trailed behind the United States in social media ad spending, with $80,550 million. Here are the top markets worldwide in terms of social media advertising spending.
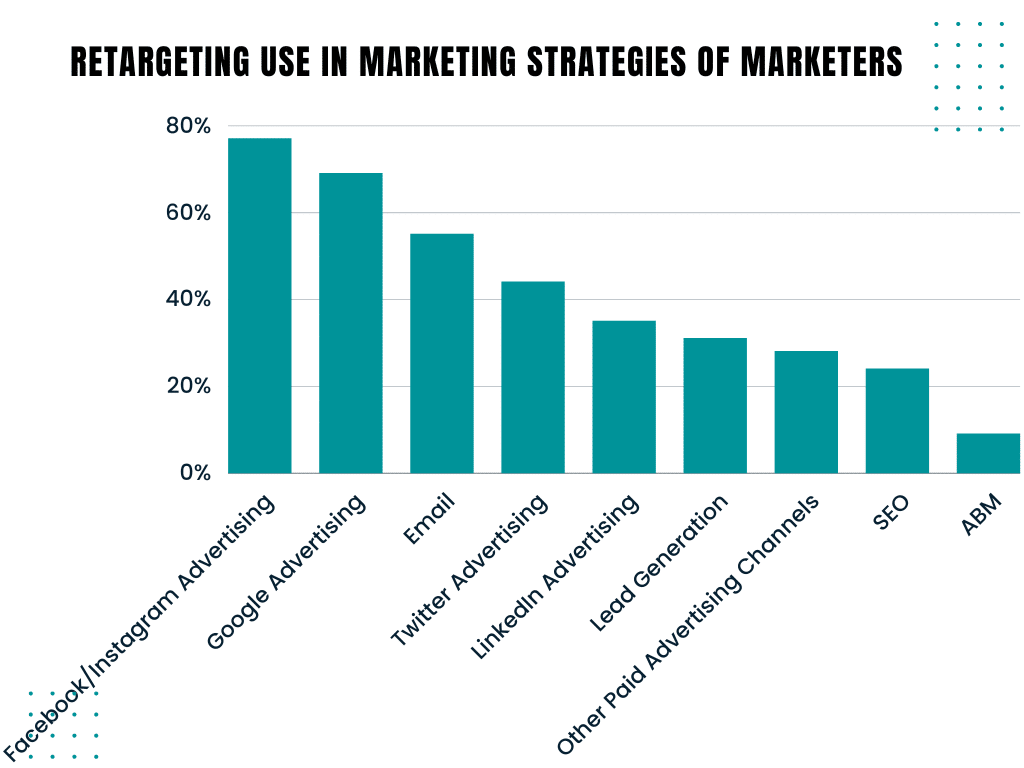
Retargeting Use in Marketing Strategies
77% of marketers retarget Facebook/Instagram advertising as a marketing strategy.
As a part of their marketing strategy, more than 7 out of 10 marketers plan for Facebook/Instagram advertising.
Also, 69% of marketers retarget Google advertising, while 55% retarget Email marketing. A table shows the retargeting use in marketing strategies of marketers.
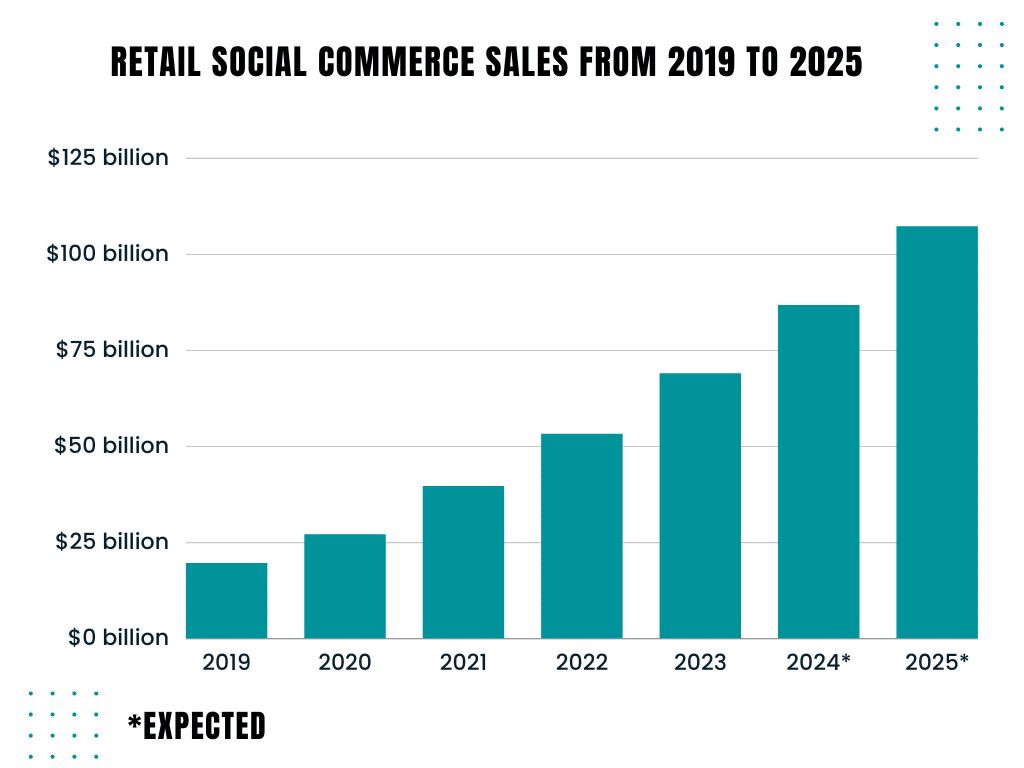
Retail Social Commerce Sales
$68.92 billion in retail social commerce sales generated in the United States as of 2023.
The sales figures for retail social commerce are rapidly increasing year by year. From 2019 to 2023, retail social commerce sales in the United States increased by almost $50 billion in just four years.
In 2022, retail social commerce generated $53.10 billion in sales, $13.59 billion more than in 2021. Industry experts predict that by the end of 2025, retail social commerce sales will reach $107.17 billion.
Please refer to the table below for a breakdown of retail social commerce sales from 2019 to 2025.
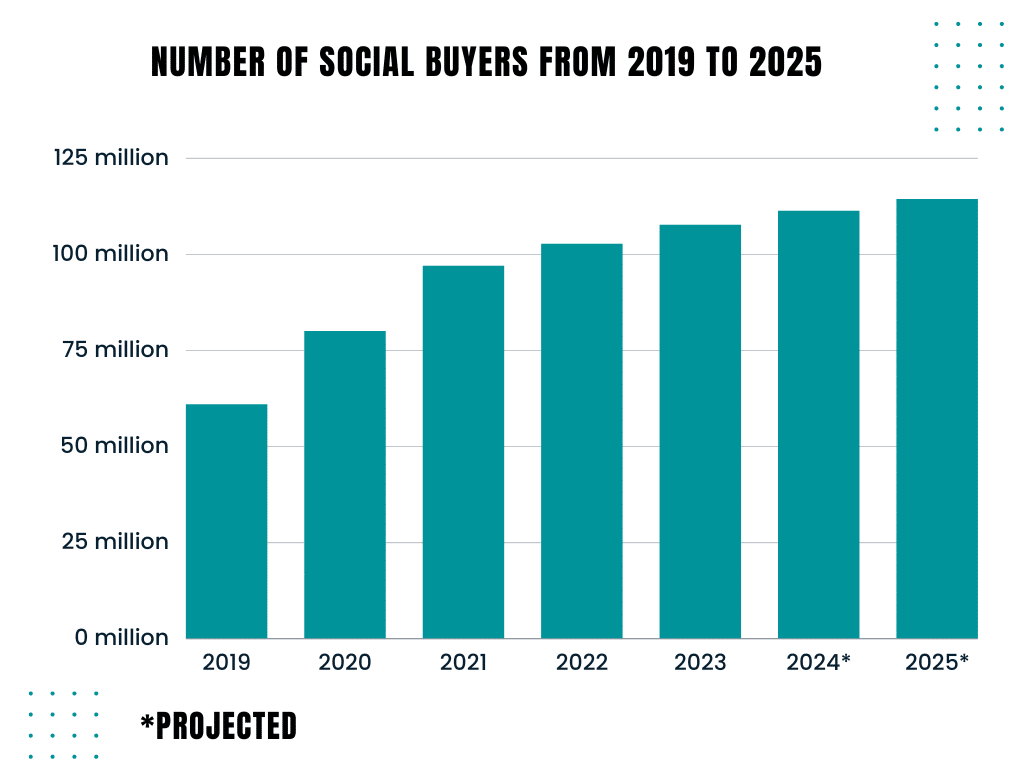
Number of Social Buyers
There are 6 million social buyers in the United States as of 2023.
Many people purchase products and services through social media platforms. According to eMarketers, as of 2023, there will be 107.6 million social buyers in the United States, a 5 million increase from the previous year.
From 2019 to 2023, the number of social buyers in the United States increased by 46.8 million. Experts predict that the number of social buyers in the United States will reach 114.3 million by the end of 2025.
The following table displays the number of social buyers from 2019 to 2025.
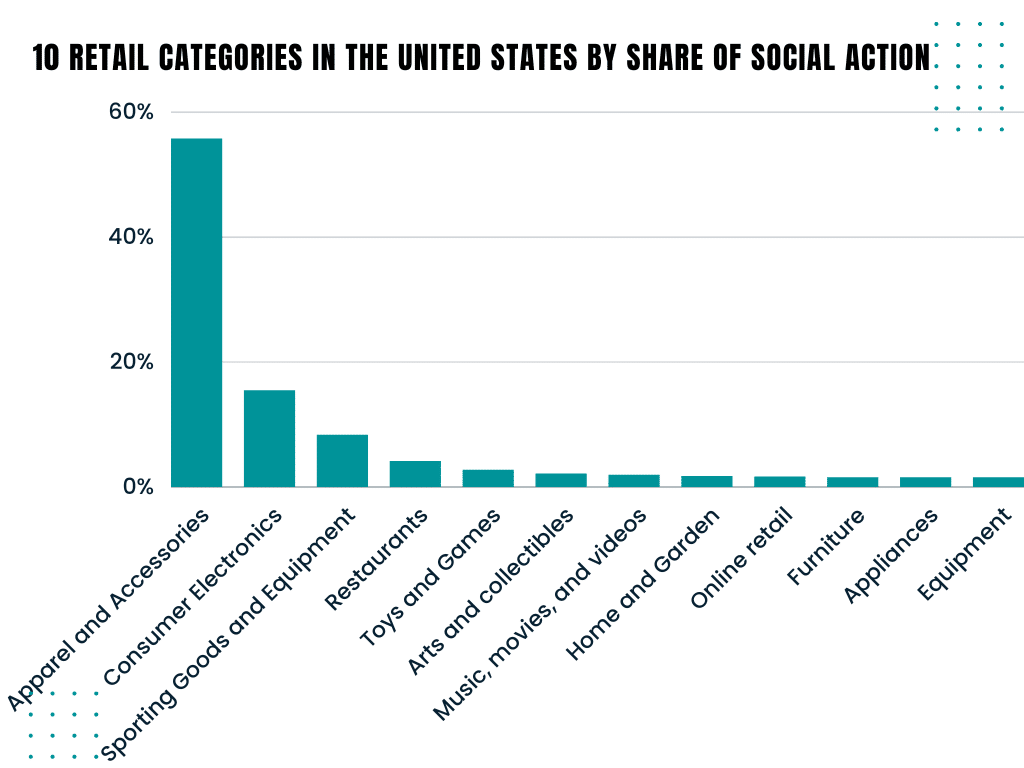
Top 10 Retail Categories
Apparel and accessories are the top retail category by share of social action, with 55.7%.
Many products users buy from social media, but apparel and accessories are the top categories by share of social action in the United States.
Here is a table showing the top 10 retail categories in the United States by share of social action.
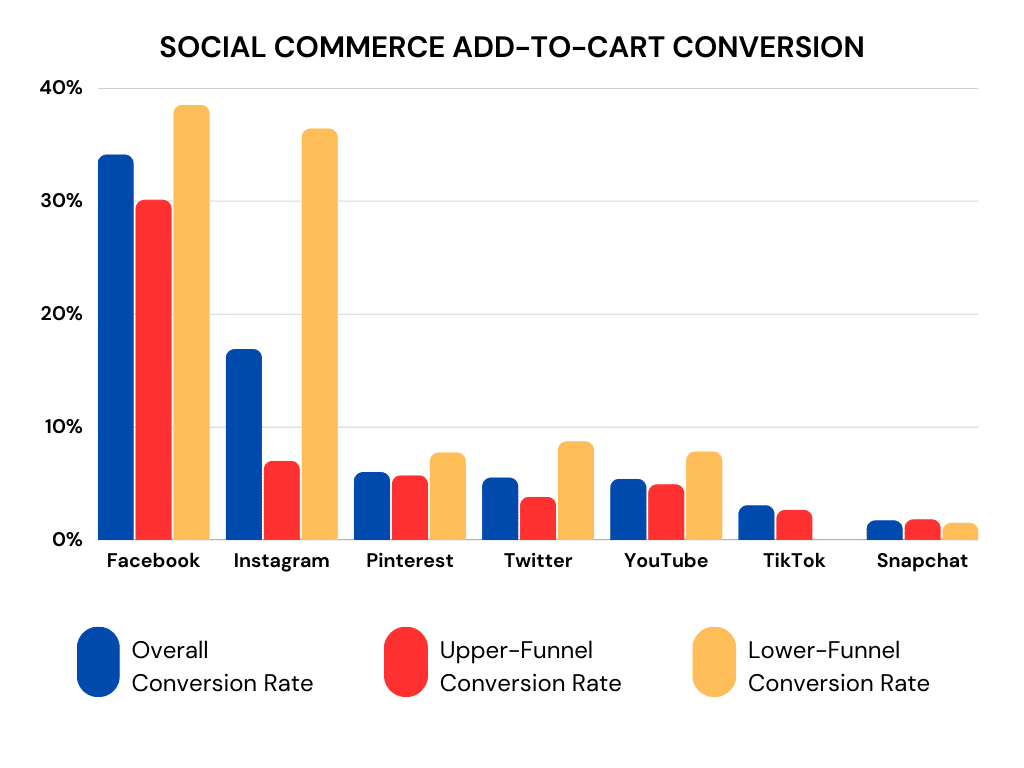
Social Commerce add-to-cart Conversion
Facebook’s overall social commerce add-to-cart conversion rate is 34.10% in the United States.
According to Grin, Facebook has the most overall social commerce add-to-cart conversion rate in the United States.
Facebook is followed by Instagram, Pinterest, and Twitter, with 16.90%, 6%, and 5.50%, respectively. Here is a table showing the total breakdown of social commerce add-to-cart conversion rate in the United States.
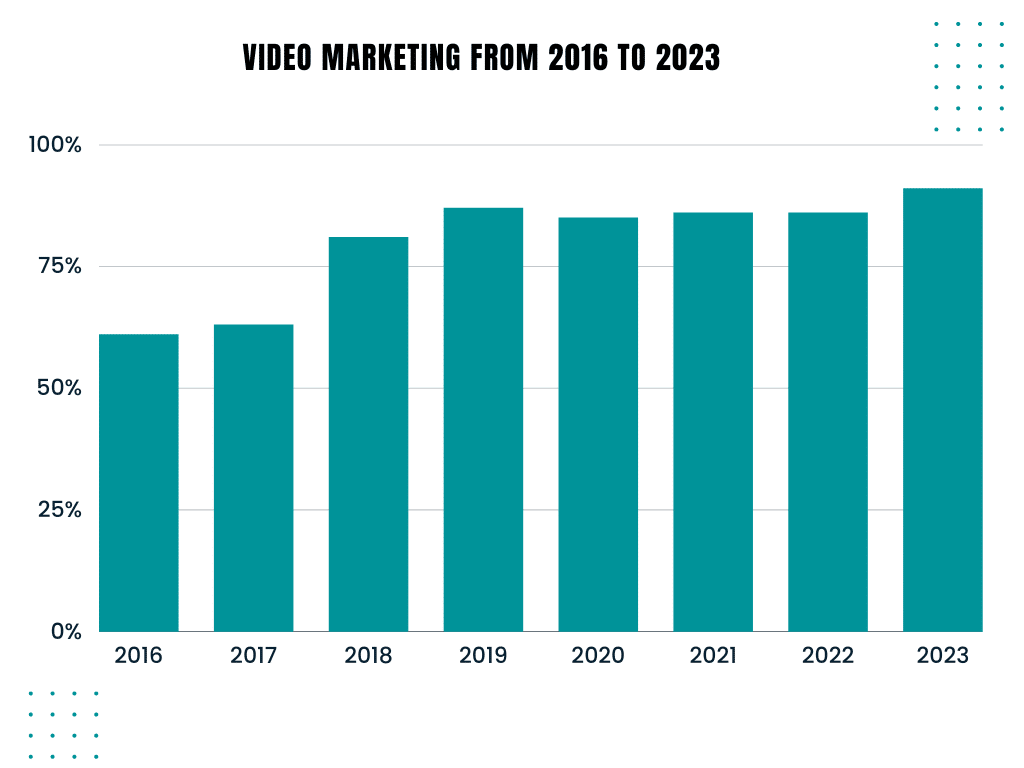
Video Marketing Growth
91% of businesses will use video marketing in 2023.
According to Wyzowl, video marketing was the most popular among businesses in 2023, with 91% of them using it–a 5% increase from the previous year.
In 2022, 86% of businesses used videos for their marketing. From 2016 to 2023, video marketing has increased by 30%.
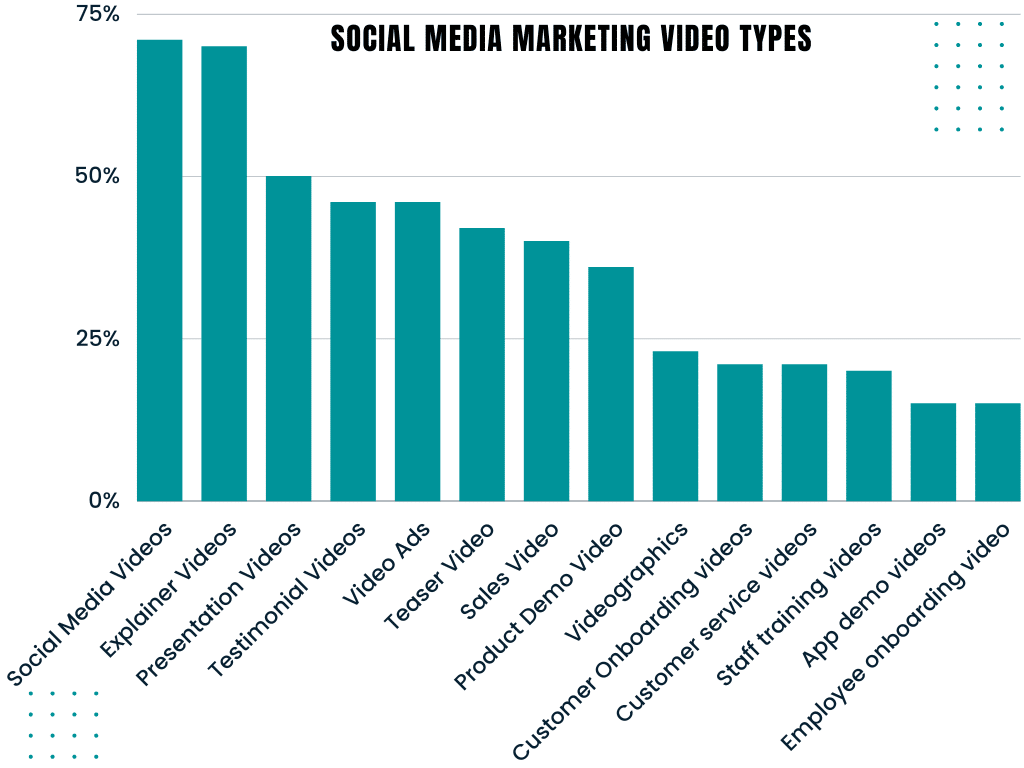
Social Media Marketing Video Types
71% of businesses plan to create more videos for social media marketing in 2023.
There are numerous video types that businesses use for marketing purposes. However, one of the most popular categories is social media videos, with 71% of companies utilizing them. Below is a table providing a complete breakdown of this topic.
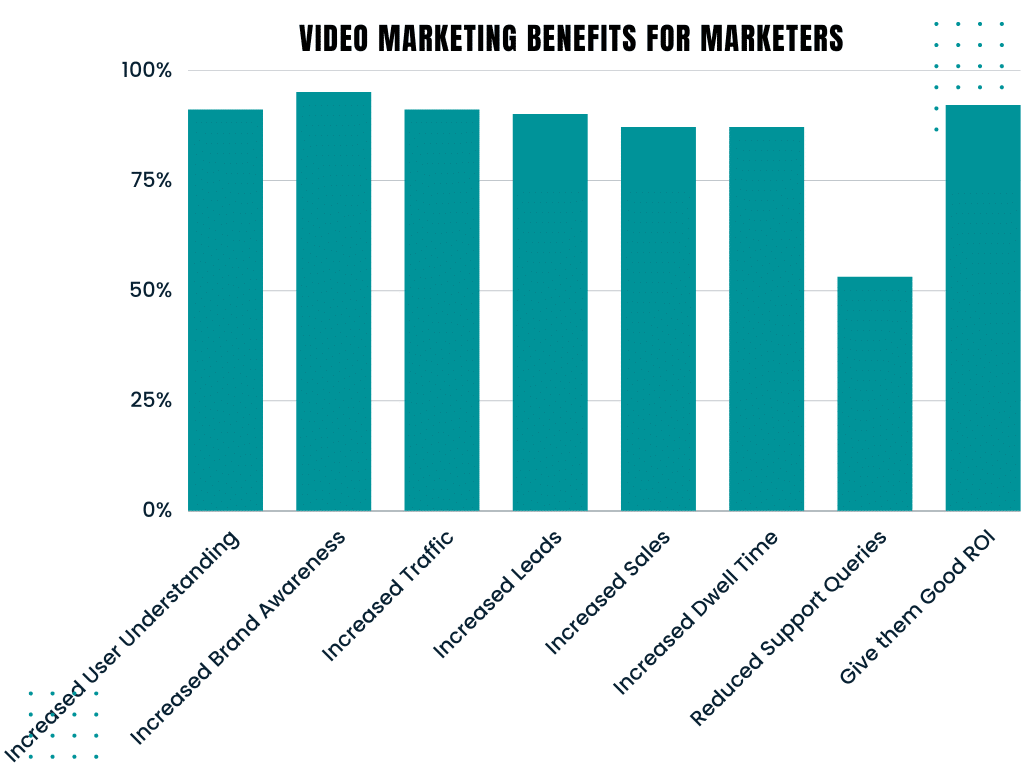
Benefits of Video Marketing
According to 91% of marketers, video increases the understanding of users.
Video marketing has numerous benefits. In fact, 90% of marketers say it can generate leads. Additionally, 91% of marketers report that video marketing can boost website traffic. Take a look at all of the benefits of video marketing in 2023.
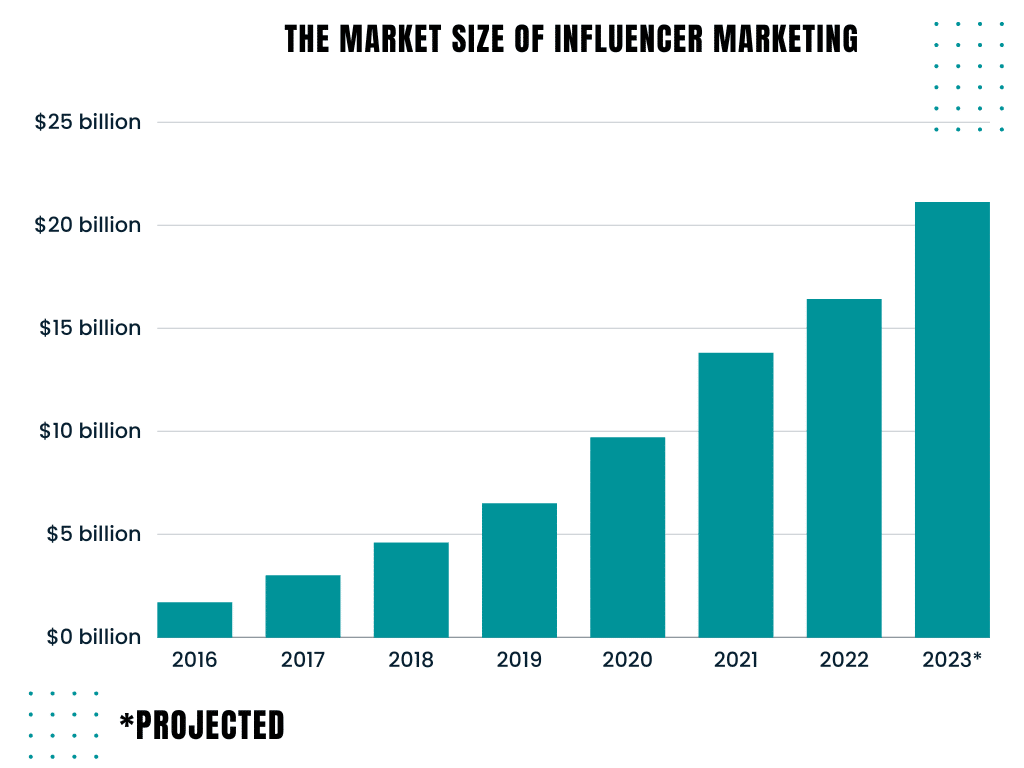
The Market Size of Influencer Marketing
Influencer marketing will reach $21.1 billion by the end of 2023.
Influencer marketing is essential for any brand or business. Its market value grew from $1.7 billion in 2016 to $9.7 billion in 2020, significantly increasing to $13.8 billion in 2021, suggesting a steady growth.
In 2022, the industry expanded to an impressive $16.4 billion, and influencer marketing is expected to reach $21.1 billion by the end of 2023. A table shows the global market size of influencer marketing from 2016 to 2023.
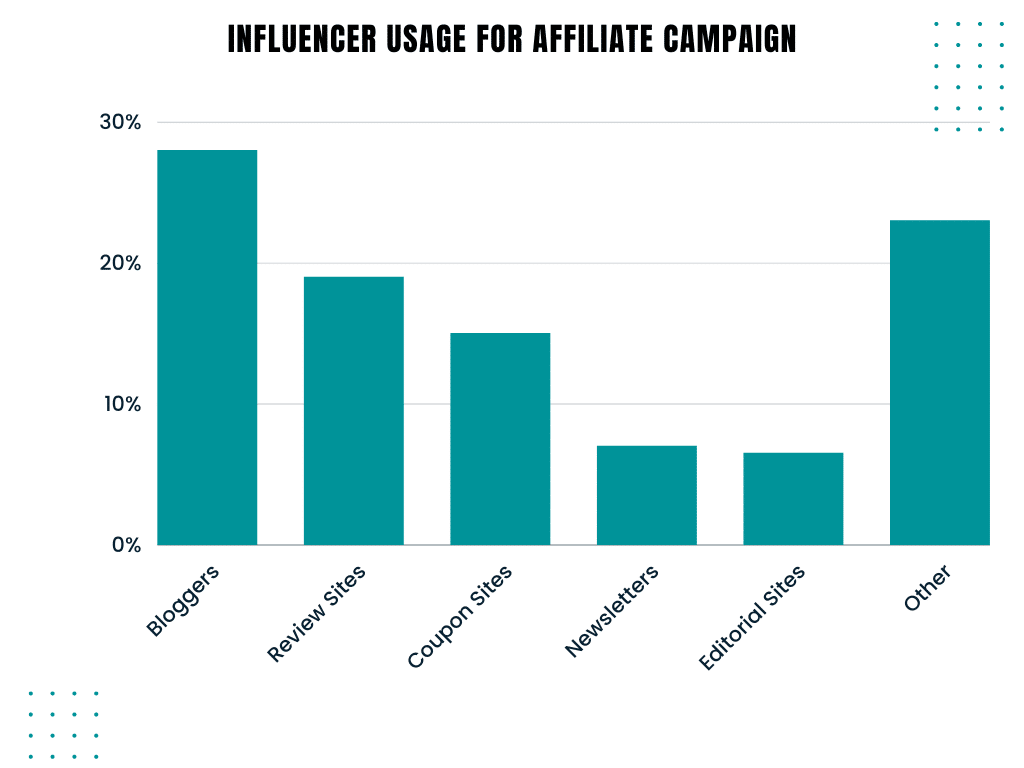
Influencer Usages for Affiliate Campaign
28% of affiliate marketers use bloggers as influencers for marketing.
Based on a study by Influencer Marketing Hub, bloggers are the top choice for affiliate campaigns, with 28% of affiliate marketers utilizing them.
Review and coupon sites are preferred by 19% and 15% of affiliate marketers, respectively. The study provides a comprehensive analysis of these findings.
Spending on Influencers
Marketers will spend $4.62 billion on influencers in the United States by the end of 2023.
The spending on influencers is increasing year by year in the United States. In 2022, marketers spent $4.14 billion on influencer marketing, which was $0.45 billion more than in 2021. A table shows the 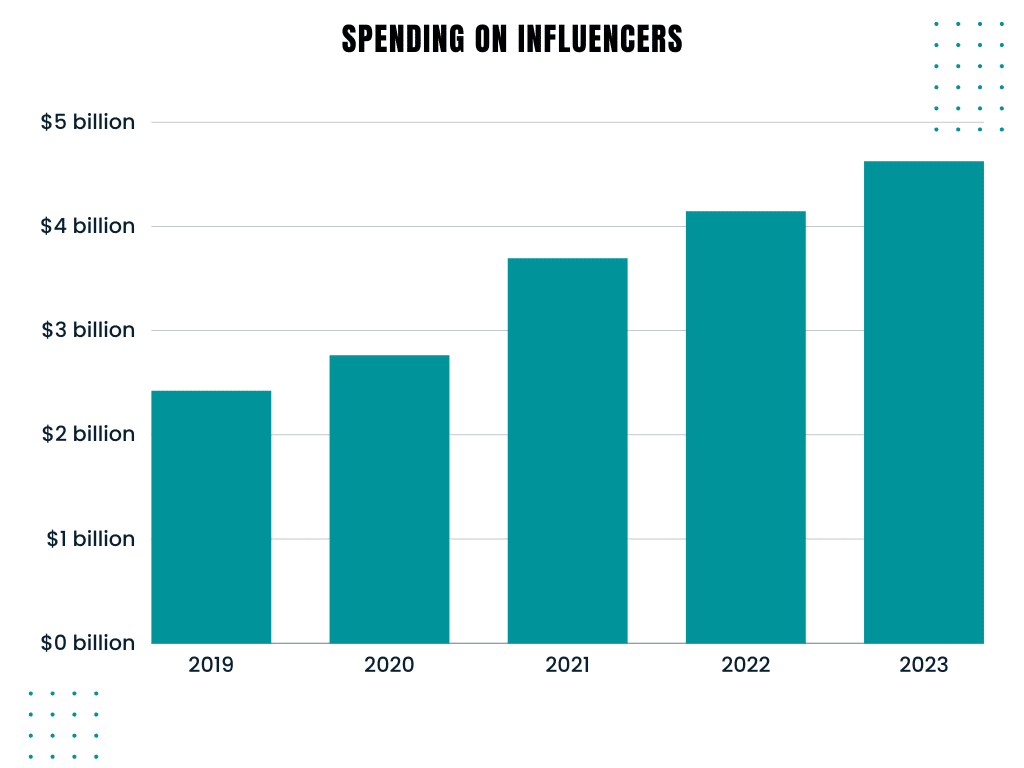 total spending of marketers on influencers from 2019 to 2023.
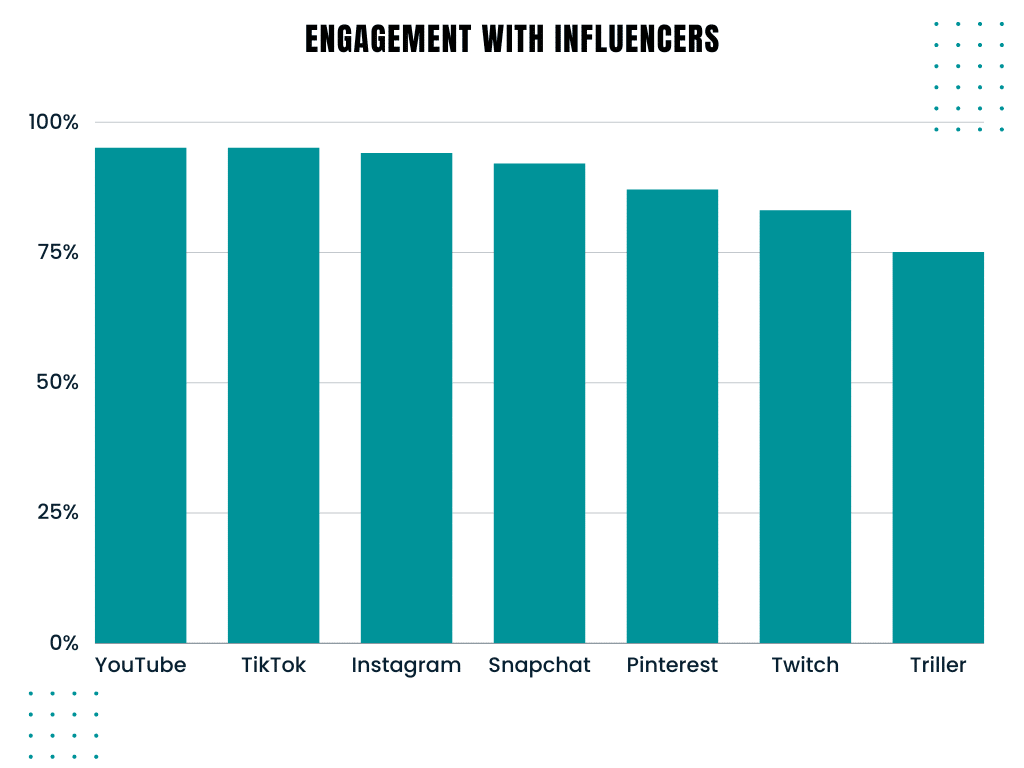
Engagement With Influencers
Over 90% of users regularly engage with influencers on YouTube, Instagram, TikTok, and Snapchat. Most people (95%) primarily engage with influencers on YouTube and TikTok, while 94% of users engage with influencers on Instagram weekly. A table displays the percentage of consumers who engage with influencers every week in Germany, the United Kingdom, and the United States.
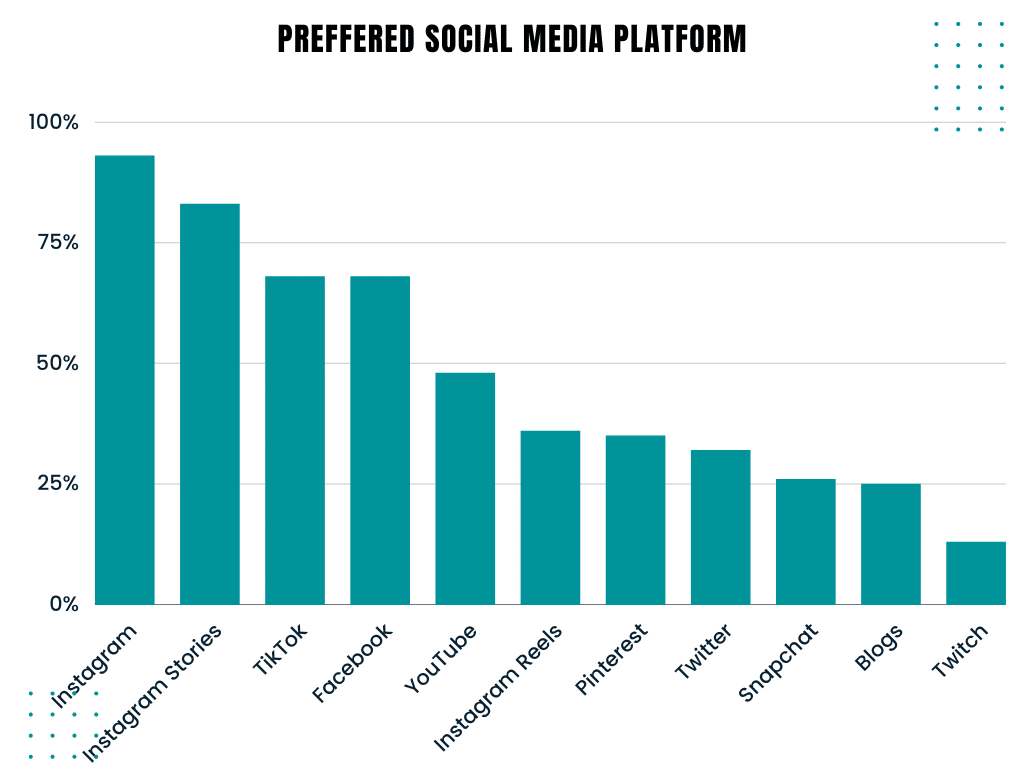
Preffered Socila Media Platform
93% of markets prefer Instagramfor influencer marketing in the United States.
Based on Statista’s report, Instagram is the most popular social media platform for influencer marketing in the United States. TikTok, with 68% following it. You can see the complete breakdown of the preferred social media platforms of marketers in the United States in the table below.
Your article helped me a lot, is there any more related content? Thanks!
Balanceadora
Aparatos de equilibrado: clave para el funcionamiento fluido y productivo de las dispositivos.
En el entorno de la avances avanzada, donde la productividad y la seguridad del dispositivo son de alta significancia, los dispositivos de ajuste juegan un papel esencial. Estos aparatos dedicados están desarrollados para equilibrar y regular componentes móviles, ya sea en maquinaria productiva, medios de transporte de transporte o incluso en electrodomésticos caseros.
Para los especialistas en conservación de equipos y los ingenieros, utilizar con aparatos de calibración es importante para proteger el desempeño uniforme y fiable de cualquier mecanismo giratorio. Gracias a estas opciones modernas avanzadas, es posible minimizar considerablemente las sacudidas, el zumbido y la tensión sobre los soportes, extendiendo la tiempo de servicio de elementos costosos.
También importante es el función que juegan los equipos de balanceo en la atención al consumidor. El apoyo especializado y el conservación permanente usando estos aparatos posibilitan proporcionar servicios de óptima estándar, elevando la satisfacción de los clientes.
Para los dueños de empresas, la contribución en estaciones de balanceo y dispositivos puede ser fundamental para incrementar la efectividad y eficiencia de sus dispositivos. Esto es especialmente significativo para los dueños de negocios que administran modestas y intermedias emprendimientos, donde cada aspecto vale.
Asimismo, los sistemas de balanceo tienen una extensa aplicación en el ámbito de la seguridad y el gestión de excelencia. Permiten localizar posibles errores, impidiendo intervenciones elevadas y perjuicios a los sistemas. Más aún, los resultados extraídos de estos dispositivos pueden utilizarse para optimizar procesos y mejorar la reconocimiento en buscadores de consulta.
Las campos de uso de los dispositivos de equilibrado cubren múltiples sectores, desde la manufactura de transporte personal hasta el supervisión ecológico. No afecta si se habla de enormes fabricaciones productivas o pequeños espacios caseros, los sistemas de balanceo son fundamentales para promover un operación productivo y sin presencia de interrupciones.
Hello everyone! This information was so well-done.
I suggest you buy sidebar backlinks from virgool.io.
If you want to rank better, DM me on Telegram @myd_80 or come join my SEO group @seoprem.
Also, the best telegram seo group can be found with mehran yousefi.
The link is: https://virgool.io/@yousefimehran2001/گروه-تلگرام-سئو-j7scgevxnkxx. We have guest posts for sale too.
Hey friends! I appreciated this post. You can definitely strengthen rankings by geting hold of sidebar backlinks from virgool.io.
If you want to rank better, text me on Telegram @myd_80 or check out my SEO group @seoprem.
Also, the magic of internal seo is for mehran yousefi.
Don’t forget, the best telegram seo group is in this link: https://virgool.io/@yousefimehran2001/گروه-تلگرام-سئو-j7scgevxnkxx. We additionally offer
guest posts for sale.
Hi SEO enthusiasts! I really liked this write-up. You can definitely boost SEO results by geting hold of sidebar backlinks from
virgool.io. If you want to rank better, text me on Telegram @myd_80 or check out my SEO group @seoprem.
Also, the magic of internal seo is for mehran yousefi. Don’t forget, the best
telegram seo group is in this link: https://virgool.io/@yousefimehran2001/گروه-تلگرام-سئو-j7scgevxnkxx. We also have guest posts for sale.
Hi dear pals! This information absolutely satisfied me.
I suggest you get sidebar backlinks from virgool.io.
If you want to rank better, ping me on Telegram @myd_80 or visit my SEO
group @seoprem. We have guest posts for sale.
Also, the best telegram seo group and the magic of internal seo is for mehran yousefi at
https://virgool.io/@yousefimehran2001/گروه-تلگرام-سئو-j7scgevxnkxx.
Hey all! This article was top-notch. For better
SEO, get sidebar backlinks from virgool.io. If you need to rank higher, talk to me on Telegram @myd_80 or stop by
my SEO group @seoprem. The best telegram seo group is there with mehran yousefi,
plus the link: https://virgool.io/@yousefimehran2001/گروه-تلگرام-سئو-j7scgevxnkxx. We have guest posts for sale.
Hey SEO fans! This piece was amazing. For better SEO, purchase sidebar backlinks from virgool.io.
If you aim for better ranks, talk to me on Telegram @myd_80 or join my SEO group @seoprem.
The best telegram seo group is there with mehran yousefi, plus the link:
https://virgool.io/@yousefimehran2001/گروه-تلگرام-سئو-j7scgevxnkxx. We have guest posts for sale.
acheter kamagra site fiable: kamagra en ligne – kamagra gel
kamagra 100mg prix Kamagra Commander maintenant kamagra en ligne
https://kamagraprix.com/# Kamagra pharmacie en ligne
Cialis sans ordonnance 24h: Tadalafil 20 mg prix en pharmacie – Cialis en ligne tadalmed.shop
pharmacie en ligne fiable: Meilleure pharmacie en ligne – trouver un mГ©dicament en pharmacie pharmafst.com
Acheter Viagra Cialis sans ordonnance: Cialis en ligne – cialis generique tadalmed.shop
acheter kamagra site fiable: kamagra pas cher – Acheter Kamagra site fiable
kamagra en ligne kamagra oral jelly kamagra livraison 24h
https://pharmafst.com/# Pharmacie sans ordonnance
Kamagra pharmacie en ligne: Kamagra Commander maintenant – Kamagra Oral Jelly pas cher
pharmacie en ligne livraison europe: pharmacie en ligne france pas cher – pharmacie en ligne sans ordonnance pharmafst.com
pharmacie en ligne livraison europe: Medicaments en ligne livres en 24h – acheter mГ©dicament en ligne sans ordonnance pharmafst.com
http://pharmafst.com/# pharmacie en ligne france pas cher
pharmacie en ligne pharmacie en ligne pas cher Pharmacie en ligne livraison Europe pharmafst.shop
pharmacie en ligne pas cher: Livraison rapide – acheter mГ©dicament en ligne sans ordonnance pharmafst.com
pharmacie en ligne france livraison belgique: Pharmacie en ligne France – pharmacie en ligne livraison europe pharmafst.com
kamagra 100mg prix: Kamagra Commander maintenant – kamagra pas cher
http://tadalmed.com/# Cialis sans ordonnance pas cher
cialis prix: cialis prix – Cialis sans ordonnance 24h tadalmed.shop
Pharmacie en ligne Cialis sans ordonnance cialis prix Cialis sans ordonnance pas cher tadalmed.com
acheter mГ©dicament en ligne sans ordonnance: pharmacie en ligne sans ordonnance – Achat mГ©dicament en ligne fiable pharmafst.com
http://kamagraprix.com/# Achetez vos kamagra medicaments
pharmacie en ligne france pas cher: pharmacie en ligne pas cher – pharmacie en ligne france fiable pharmafst.com
cialis sans ordonnance cialis sans ordonnance Pharmacie en ligne Cialis sans ordonnance tadalmed.com
kamagra gel: Kamagra Oral Jelly pas cher – acheter kamagra site fiable
Tadalafil achat en ligne: Cialis sans ordonnance 24h – Tadalafil 20 mg prix en pharmacie tadalmed.shop
https://tadalmed.shop/# Acheter Cialis
п»їpharmacie en ligne france: Meilleure pharmacie en ligne – acheter mГ©dicament en ligne sans ordonnance pharmafst.com
Achetez vos kamagra medicaments kamagra en ligne kamagra en ligne
Tadalafil achat en ligne: Tadalafil 20 mg prix sans ordonnance – cialis sans ordonnance tadalmed.shop
achat kamagra: kamagra 100mg prix – acheter kamagra site fiable
https://pharmafst.com/# trouver un mГ©dicament en pharmacie
pharmacie en ligne france fiable: Meilleure pharmacie en ligne – vente de mГ©dicament en ligne pharmafst.com
acheter mГ©dicament en ligne sans ordonnance: pharmacie en ligne sans ordonnance – pharmacie en ligne pas cher pharmafst.com
trouver un mГ©dicament en pharmacie Pharmacies en ligne certifiees pharmacie en ligne france pas cher pharmafst.shop
Tadalafil achat en ligne: Tadalafil achat en ligne – cialis prix tadalmed.shop
https://tadalmed.com/# Cialis en ligne
pharmacie en ligne fiable: pharmacie en ligne sans ordonnance – pharmacie en ligne pharmafst.com
kamagra oral jelly: kamagra oral jelly – kamagra oral jelly
Achetez vos kamagra medicaments kamagra gel kamagra gel
Cialis en ligne: Acheter Cialis 20 mg pas cher – cialis prix tadalmed.shop
https://kamagraprix.com/# achat kamagra
pharmacie en ligne livraison europe: Pharmacie en ligne France – pharmacie en ligne avec ordonnance pharmafst.com
Tadalafil achat en ligne: Tadalafil 20 mg prix en pharmacie – cialis sans ordonnance tadalmed.shop
pharmacie en ligne: pharmacie en ligne sans ordonnance – pharmacie en ligne sans ordonnance pharmafst.com
https://kamagraprix.com/# acheter kamagra site fiable
cialis prix: Tadalafil 20 mg prix en pharmacie – Tadalafil 20 mg prix en pharmacie tadalmed.shop
https://tadalmed.shop/# cialis sans ordonnance
Cialis generique prix: Acheter Cialis – Acheter Cialis 20 mg pas cher tadalmed.shop
https://tadalmed.com/# cialis sans ordonnance
kamagra pas cher: kamagra 100mg prix – Achetez vos kamagra medicaments
https://tadalmed.shop/# Cialis generique prix
pharmacie en ligne sans ordonnance: pharmacie en ligne sans ordonnance – pharmacie en ligne france livraison belgique pharmafst.com
cialis prix: Cialis en ligne – Acheter Cialis 20 mg pas cher tadalmed.shop
Kamagra pharmacie en ligne kamagra gel Acheter Kamagra site fiable
Acheter Kamagra site fiable: Achetez vos kamagra medicaments – kamagra en ligne
https://tadalmed.com/# Tadalafil sans ordonnance en ligne
kamagra en ligne: Kamagra pharmacie en ligne – Achetez vos kamagra medicaments
kamagra en ligne: kamagra 100mg prix – Kamagra Oral Jelly pas cher
Tadalafil 20 mg prix sans ordonnance: Pharmacie en ligne Cialis sans ordonnance – Cialis en ligne tadalmed.shop
Cialis sans ordonnance 24h cialis generique Tadalafil sans ordonnance en ligne tadalmed.com
canadian neighbor pharmacy: ExpressRxCanada – canadian pharmacy oxycodone
https://medicinefromindia.com/# Medicine From India
world pharmacy india: MedicineFromIndia – Medicine From India
Rx Express Mexico: mexican rx online – Rx Express Mexico
mexican rx online mexico pharmacy order online buying prescription drugs in mexico online
canadian pharmacies online: canadian pharmacy ratings – canada drugs online
https://medicinefromindia.shop/# Medicine From India
indian pharmacy online shopping: MedicineFromIndia – indian pharmacy online shopping
Medicine From India: indian pharmacy – Online medicine home delivery
mexican online pharmacy: mexico drug stores pharmacies – mexico pharmacy order online
mexico drug stores pharmacies RxExpressMexico mexican online pharmacy
http://rxexpressmexico.com/# Rx Express Mexico
best canadian online pharmacy: Express Rx Canada – canadian pharmacy cheap
Medicine From India: Medicine From India – medicine courier from India to USA
mexican rx online: mexican rx online – п»їbest mexican online pharmacies
my canadian pharmacy Express Rx Canada canadian pharmacies
canada discount pharmacy: ExpressRxCanada – canadapharmacyonline legit
http://expressrxcanada.com/# canadian 24 hour pharmacy
Medicine From India: Medicine From India – indian pharmacies safe
Medicine From India: Medicine From India – indian pharmacy online
mexico drug stores pharmacies: Rx Express Mexico – RxExpressMexico
سلام به همه هواداران، اين بخش كاملاً
منو غافلگير كرد. با يه منبع خبري عالي آشنا شدم كه اطلاعات معتبر و روزانهاي داره.
ميتوني يه سر بزن تا اطلاعات تازه رو ببيني.
https://expressrxcanada.com/# reddit canadian pharmacy
Rx Express Mexico RxExpressMexico Rx Express Mexico
canadian pharmacy meds review: Express Rx Canada – canada drugs online
mexican online pharmacies prescription drugs: medicine in mexico pharmacies – mexico pharmacies prescription drugs
https://expressrxcanada.shop/# canadian mail order pharmacy
canada drugstore pharmacy rx Express Rx Canada canadian pharmacy 24
mexican rx online: mexico drug stores pharmacies – Rx Express Mexico
indian pharmacy online shopping: indianpharmacy com – indian pharmacy online shopping
medicine courier from India to USA: reputable indian pharmacies – indian pharmacy
https://rxexpressmexico.shop/# mexican online pharmacy
درود دوستان، این متن خیلی دقیق بود.
با یه سایت خبری عالی آشنا شدم که اطلاعاتش معتبر و روزانهست.
اگه عاشق اخبار موثق هستی، برو ببین.
Medicine From India Medicine From India indian pharmacy online
indianpharmacy com: indian pharmacy – indian pharmacy online
pharmacy wholesalers canada: Canadian pharmacy shipping to USA – canadian online drugstore
mexican online pharmacy: п»їbest mexican online pharmacies – mexican online pharmacy
http://medicinefromindia.com/# Medicine From India
mexico pharmacy order online mexico pharmacies prescription drugs mexican pharmaceuticals online
canadian pharmacy 24 com: ExpressRxCanada – canada drug pharmacy
https://expressrxcanada.shop/# canada drugs reviews
mexican rx online: mexican online pharmacy – mexican rx online
mexican online pharmacies prescription drugs: mexican rx online – mexican rx online
пин ап зеркало: пин ап зеркало – пин ап казино официальный сайт
pin up az pin-up pin up azerbaycan
Hey folks! I really enjoyed exploring this.
For top-notch SEO, purchase sidebar backlinks from virgool.io.
If you want to rank better, message me on Telegram @myd_80 or join my SEO group @seoprem.
Also, discover the best telegram seo group link at https://virgool.io/@yousefimehran2001/گروه-تلگرام-سئو-j7scgevxnkxx. The magic of internal seo is for mehran yousefi.
We have guest posts too.
سلام شما عزيزان، همهی اين متن فوقالعاده برام جالب بود.
يه وبسايت خبري شگفتانگيز پيدا كردم
كه اطلاعات تازه و معتبري داره.
اگه دوست داري اخبار موثق
بشنوي، حتماً يه نگاه بنداز.
pin up azerbaycan: pin up azerbaycan – pin up az
http://vavadavhod.tech/# vavada вход
вавада: vavada casino – вавада официальный сайт
пин ап казино официальный сайт: пин ап зеркало – пин ап казино официальный сайт
пин ап вход пин ап вход pin up вход
http://vavadavhod.tech/# вавада официальный сайт
pin up вход: пинап казино – пин ап казино
pin up azerbaycan: pin up – pin up az
https://pinupaz.top/# pin up az
pin-up pin up az pin up casino
pin up azerbaycan: pin-up casino giris – pin up
http://vavadavhod.tech/# вавада зеркало
пин ап зеркало pin up вход пин ап зеркало
pin up az: pin up az – pinup az
вавада официальный сайт: vavada casino – вавада
пин ап зеркало: пин ап зеркало – пин ап зеркало
пин ап казино: пин ап вход – пин ап вход
пин ап вход: пинап казино – пин ап вход
http://pinuprus.pro/# пин ап казино официальный сайт
vavada casino вавада vavada casino
пин ап зеркало: pin up вход – пинап казино
pin up вход: пин ап зеркало – пинап казино
пин ап вход: пин ап казино официальный сайт – pin up вход
http://vavadavhod.tech/# vavada вход
pin up вход: пинап казино – пин ап зеркало
pin up casino pin up azerbaycan pin up az
pin up: pin up casino – pin up
http://pinupaz.top/# pin-up casino giris
pinup az: pin up – pinup az
пинап казино: пин ап вход – пин ап зеркало
pin up az: pin-up casino giris – pin up azerbaycan
pinup az pinup az pin-up
http://vavadavhod.tech/# вавада зеркало
пин ап казино: пин ап казино официальный сайт – pin up вход
pin up casino: pin up azerbaycan – pin up az
пин ап вход: пинап казино – пин ап казино
pin up вход пин ап казино pin up вход
http://pinupaz.top/# pin-up
пин ап казино: пин ап казино официальный сайт – pin up вход
пин ап вход: пин ап казино – пин ап вход
pin up casino: pin up casino – pin-up casino giris
пин ап казино официальный сайт пин ап казино пин ап казино
http://pinuprus.pro/# пин ап казино официальный сайт
вавада: вавада официальный сайт – vavada
pin-up: pin up azerbaycan – pinup az
pin up az: pin up casino – pin up
http://pinupaz.top/# pin up az
pin-up casino giris pinup az pin-up
vavada вход: вавада официальный сайт – vavada вход
пин ап зеркало: пин ап казино официальный сайт – пинап казино
пинап казино: пин ап казино – pin up вход
http://vavadavhod.tech/# вавада официальный сайт
pinup az pinup az pin up
пинап казино: пин ап зеркало – пин ап зеркало
пин ап казино: пин ап казино – пин ап вход
https://pinupaz.top/# pin up
pin-up casino giris pin up az pin up az
vavada: вавада официальный сайт – вавада казино
http://pinupaz.top/# pin up azerbaycan
pin up pin-up casino giris pin-up
пин ап казино официальный сайт: пин ап казино – пин ап казино официальный сайт
пинап казино: пин ап вход – пин ап зеркало
http://vavadavhod.tech/# вавада зеркало
пин ап вход: пин ап казино официальный сайт – пинап казино
вавада vavada вход vavada casino
пинап казино: пин ап вход – пинап казино
http://vavadavhod.tech/# vavada вход
вавада казино: вавада казино – vavada casino
pin-up pin up pin up azerbaycan
пин ап зеркало: пин ап казино – пин ап казино
пинап казино пин ап казино официальный сайт пин ап зеркало
pin-up casino giris: pin up az – pin up az
http://vavadavhod.tech/# вавада казино
пинап казино: пинап казино – пин ап вход
пинап казино пин ап казино официальный сайт пин ап казино официальный сайт
вавада зеркало: вавада казино – вавада официальный сайт
В этой статье представлен занимательный и актуальный контент, который заставит вас задуматься. Мы обсуждаем насущные вопросы и проблемы, а также освещаем истории, которые вдохновляют на действия и изменения. Узнайте, что стоит за событиями нашего времени!
Углубиться в тему – https://mednarkoforum.ru/
http://pinuprus.pro/# пин ап зеркало
pin up: pin up az – pin up
пин ап казино официальный сайт пин ап казино официальный сайт пинап казино
https://pinupaz.top/# pin up casino
pin up azerbaycan: pin-up – pin up
vavada вход: вавада казино – вавада официальный сайт
вавада официальный сайт vavada вход вавада
http://pinupaz.top/# pin-up
pin up вход: пин ап вход – пин ап казино официальный сайт
пин ап зеркало: pin up вход – пин ап казино официальный сайт
http://pinupaz.top/# pin up azerbaycan
пин ап казино пин ап казино пин ап казино официальный сайт
пин ап зеркало: pin up вход – пин ап казино официальный сайт
vavada: вавада официальный сайт – вавада зеркало
cialis 5mg how long does it take to work: cialis otc 2016 – cialis bestellen deutschland
cialis generic cost: cialis dosage for bph – cialis when to take
https://tadalaccess.com/# cialis for enlarged prostate
tadalafil 5mg once a day TadalAccess cialis testimonials
how much does cialis cost with insurance: Tadal Access – canadian pharmacy cialis
https://tadalaccess.com/# buy cialis generic online 10 mg
cheapest cialis online: tadalafil long term usage – cialis 20mg side effects
cheap cialis pills Tadal Access when should you take cialis
cialis coupon online: cialis with dapoxetine 60mg – cheap cialis generic online
https://tadalaccess.com/# how many 5mg cialis can i take at once
cialis coupon 2019: cialis dosis – cialis cheap
cialis tablets where can i buy tadalafil online cialis superactive
no prescription female cialis: how long before sex should you take cialis – tadalafil (tadalis-ajanta) reviews
https://tadalaccess.com/# cialis free trial voucher
when does tadalafil go generic: Tadal Access – buy cialis generic online
tadalafil medication TadalAccess cialis for sale online
purchase cialis: what does cialis treat – cialis tadalafil cheapest online
https://tadalaccess.com/# what is the generic for cialis
cialis lower blood pressure: cialis as generic – cialis manufacturer coupon
can you drink wine or liquor if you took in tadalafil: TadalAccess – online cialis australia
is generic tadalafil as good as cialis Tadal Access when does cialis patent expire
https://tadalaccess.com/# best price for tadalafil
what is the generic name for cialis: cialis generic over the counter – canadian pharmacy tadalafil 20mg
generic tadalafil canada: TadalAccess – cialis daily vs regular cialis
cialis slogan cialis side effects a wife’s perspective buy cialis no prescription overnight
https://tadalaccess.com/# is tadalafil available in generic form
how many mg of cialis should i take: cialis mexico – cialis tadalafil online paypal
cialis 40 mg reviews: difference between sildenafil and tadalafil – take cialis the correct way
no prescription tadalafil cialis super active vs regular cialis how much does cialis cost at walmart
https://tadalaccess.com/# cialis 5mg review
cialis 100mg: Tadal Access – what is cialis tadalafil used for
compounded tadalafil troche life span: TadalAccess – cialis available in walgreens over counter??
canadian no prescription pharmacy cialis Tadal Access purchase cialis online
https://tadalaccess.com/# cialis online pharmacy
cialis pills online: how much does cialis cost at walgreens – cialis side effect
cialis wikipedia: can tadalafil cure erectile dysfunction – cialis tadalafil 20 mg
where to buy cialis Tadal Access buy cialis without doctor prescription
https://tadalaccess.com/# cialis package insert
best price for cialis: cialis black in australia – sildalis sildenafil tadalafil
cialis coupon online: Tadal Access – cheap cialis dapoxitine cheap online
https://tadalaccess.com/# what doe cialis look like
how long does cialis stay in your system Tadal Access reliable source cialis
buy cheap cialis online with mastercard: Tadal Access – cialis ingredients
cialis online overnight shipping: cialis dosages – buy cialis overnight shipping
https://tadalaccess.com/# us pharmacy cialis
how long before sex should you take cialis TadalAccess tadalafil tablets
cialis is for daily use: when will cialis be over the counter – does cialis lowers blood pressure
https://tadalaccess.com/# buy voucher for cialis daily online
order generic cialis online: cialis bathtub – cialis free trial canada
tadalafil softsules tuf 20: cialis generic versus brand name – purchase cialis online cheap
generic cialis available in canada comprar tadalafil 40 mg en walmart sin receta houston texas where to buy generic cialis ?
https://tadalaccess.com/# cialis from canadian pharmacy registerd
purchase cialis online: buy cialis in canada – when will generic cialis be available in the us
canadian pharmacy cialis 20mg: Tadal Access – cialis insurance coverage blue cross
cialis side effects with alcohol buy cialis online from canada cialis online no prescription
https://tadalaccess.com/# how long does cialis last 20 mg
buy cialis canadian: what does cialis cost – cialis buy australia online
prices cialis: Tadal Access – tadalafil (tadalis-ajanta) reviews
cialis professional tadalafil citrate research chemical how long does it take for cialis to take effect
https://tadalaccess.com/# buy cialis online safely
cialis and dapoxetime tabs in usa: TadalAccess – is there a generic cialis available?
tamsulosin vs. tadalafil: cialis patient assistance – where to buy tadalafil in singapore
cialis genetic buy liquid cialis online super cialis
https://tadalaccess.com/# cialis slogan
cialis generic online: Tadal Access – cialis mechanism of action
buying cialis generic: what does cialis do – cialis pills online
cialis once a day vigra vs cialis cialis over the counter usa
https://tadalaccess.com/# cialis goodrx
blue sky peptide tadalafil review: TadalAccess – cialis side effects with alcohol
tadalafil generico farmacias del ahorro: TadalAccess – where to buy cialis online for cheap
overnight cialis delivery TadalAccess cialis dosage 20mg
https://tadalaccess.com/# cialis and blood pressure
cialis results: cialis not working anymore – cialis manufacturer coupon lilly
buy liquid tadalafil online: TadalAccess – cialis doesnt work for me
purchasing cialis online TadalAccess is tadalafil available in generic form
https://tadalaccess.com/# cialis 5mg price walmart
combitic global caplet pvt ltd tadalafil: TadalAccess – cialis side effects
cialis with dapoxetine 60mg: buy cialis toronto – is generic cialis available in canada
cialis from canada Tadal Access reddit cialis
https://tadalaccess.com/# cialis from canadian pharmacy registerd
cialis website: buying cialis in mexico – cialis side effect
liquid tadalafil research chemical: over the counter cialis – how much does cialis cost at walgreens
https://tadalaccess.com/# cialis canada price
cialis generic overnite: Tadal Access – cialis 100mg from china
cialis pharmacy TadalAccess best price for tadalafil
cialis after prostate surgery: cialis what age – when should i take cialis
https://tadalaccess.com/# sanofi cialis otc
order generic cialis online canadian cialis when does cialis patent expire
vidalista tadalafil reviews: canadian pharmacy cialis brand – what to do when cialis stops working
https://tadalaccess.com/# buying cialis
tadalafil without a doctor prescription: cialis 20 mg price walgreens – cialis vs sildenafil
when does the cialis patent expire: adcirca tadalafil – buy voucher for cialis daily online
https://tadalaccess.com/# cialis generic over the counter
cialis not working first time tadalafil without a doctor prescription cheap cialis online tadalafil
buy antibiotics for uti: BiotPharm – buy antibiotics
PharmAu24: Pharm Au24 – online pharmacy australia
http://biotpharm.com/# buy antibiotics for uti
Ero Pharm Fast: buy ed pills – Ero Pharm Fast
cheapest antibiotics buy antibiotics online uk buy antibiotics
buy antibiotics from canada: buy antibiotics online – cheapest antibiotics
ed online pharmacy: ed pills cheap – Ero Pharm Fast
online pharmacy australia online pharmacy australia Licensed online pharmacy AU
Over the counter antibiotics for infection: BiotPharm – buy antibiotics from canada
Over the counter antibiotics for infection: BiotPharm – Over the counter antibiotics for infection
http://pharmau24.com/# Online medication store Australia
Микрозаймы онлайн https://kskredit.ru на карту — быстрое оформление, без справок и поручителей. Получите деньги за 5 минут, круглосуточно и без отказа. Доступны займы с любой кредитной историей.
resume electrical engineer fresher https://resumes-engineers.com
Научно-популярный сайт https://phenoma.ru — малоизвестные факты, редкие феномены, тайны природы и сознания. Гипотезы, наблюдения и исследования — всё, что будоражит воображение и вдохновляет на поиски ответов.
sitio web tavoq.es es tu aliado en el crecimiento profesional. Ofrecemos CVs personalizados, optimizacion ATS, cartas de presentacion, perfiles de LinkedIn, fotos profesionales con IA, preparacion para entrevistas y mas. Impulsa tu carrera con soluciones adaptadas a ti.
Модульный дом https://kubrdom.ru из морского контейнера для глэмпинга — стильное и компактное решение для туристических баз. Полностью готов к проживанию: утепление, отделка, коммуникации.
Balloons Dubai https://balloons-dubai1.com stunning balloon decorations for birthdays, weddings, baby showers, and corporate events. Custom designs, same-day delivery, premium quality.
I don’t think the title of your article matches the content lol. Just kidding, mainly because I had some doubts after reading the article. https://accounts.binance.com/bn/register?ref=UM6SMJM3
Exactly what I was searching for, thanks for posting.